
ファイル:Global temperature 1ka.png
このプレビューのサイズ: 800 × 475 ピクセル。 その他の解像度: 320 × 190 ピクセル | 640 × 380 ピクセル | 1,200 × 712 ピクセル。
元のファイル (1,200 × 712 ピクセル、ファイルサイズ: 35キロバイト、MIME タイプ: image/png)
ウィキメディア・コモンズのファイルページにある説明を、以下に表示します。
|
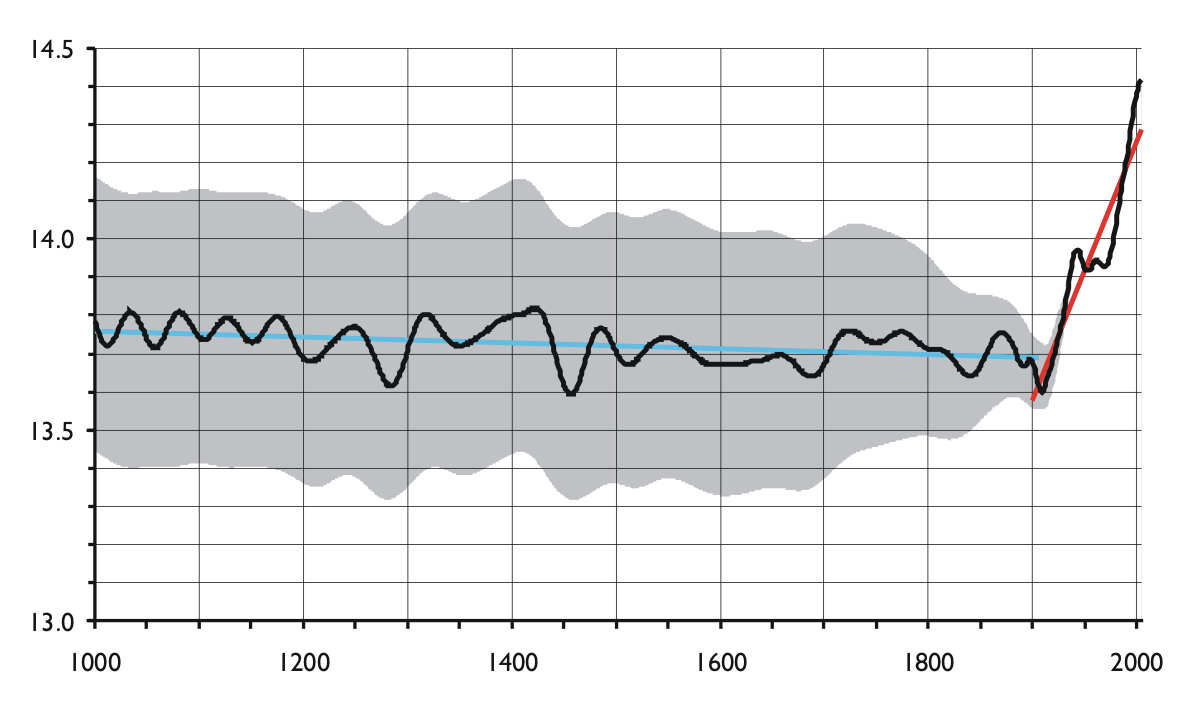
- Description: Global temperature. Axes are not labelled in order to keep the diagram language neutral; x-axis: year A.D. (1000–2004), y-axis: global temperature in °C. The black line is the smoothed global mean. The grey area is the smoothed 95% confidence interval of the estimates. The blue line is the regression line for the period 1000–1899. The red line is the regression line for the period 1900–2004.
The diagram illustrates several aspects of global warming. The rapid increase (as well as the earlier slow decrease) is statistically highly significant. One can also see that the 1990s most probably have been the last millenium's warmest decade.
Caution is required in interpretation, however, because the data prior to 1881 are estimates based on proxies (such as tree rings and ice cores). This makes both the accuracy and the temporal resolution of the estimates poorer than for the last century. Single years most certainly lay outside the confidence intervals. This does probably not affect the above conclusion about the 1990 decade, however. - Source: graph drawn by Hanno using data from two sources. For the years 1000–1880, temperature estimates were taken from P.D. Jones & M.E. Mann (2004): "Climate over past millenia". Reviews of Geophysics, 42, article number RG2002. For the remainder, temperatures are based on instrumental records published on the web by P.D. Jones, D.E. Parker, T.J. Osborn & K.R. Briffa (2005) as "Global and hemispheric temperature anomalies – land and marine instrumental records". In Trends: A Compendium of Data on Global Change. Carbon Dioxide Information Analysis Center, Oak Ridge National Laboratory, U.S. Department of Energy, Oak Ridge, Tenn., U.S.A. [http://cdiac.esd.ornl.gov/trends/temp/jonescru/jones.html]
- Licence: released into the public domain by the originator
| この著作物の著作権者である私は、この著作物における権利を放棄しパブリックドメインとします。これは全世界で適用されます。 一部の国では、これが法的に可能ではない場合があります。その場合は、次のように宣言します。 私は、あらゆる人に対して、法により必要とされている条件を除き、如何なる条件も課すことなく、あらゆる目的のためにこの著作物を使用する権利を与えます。 |

|
このグラフ画像は、ベクターイメージである SVG ファイルとして再作成されるべきです。これにはいくつかの利点があります。詳しくはCommons:Media for cleanupを参照してください。この画像の SVG 形式がすでに利用可能である場合は、アップロードしてください。アップロード後、この画像にあるこのテンプレートを{{Vector version available|新しい画像ファイル名.svg}}テンプレートで置き換えてください。
|
ファイルの履歴
過去の版のファイルを表示するには、その版の日時をクリックしてください。
| 日付と時刻 | サムネイル | 寸法 | 利用者 | コメント | |
|---|---|---|---|---|---|
| 現在の版 | 2005年11月9日 (水) 15:49 | | 1,200 × 712 (35キロバイト) | Hanno |
ファイルの使用状況
以下の 2 ページがこのファイルを使用しています:
グローバルなファイル使用状況
以下に挙げる他のウィキがこの画像を使っています:
- fr.wikipedia.org での使用状況