概要
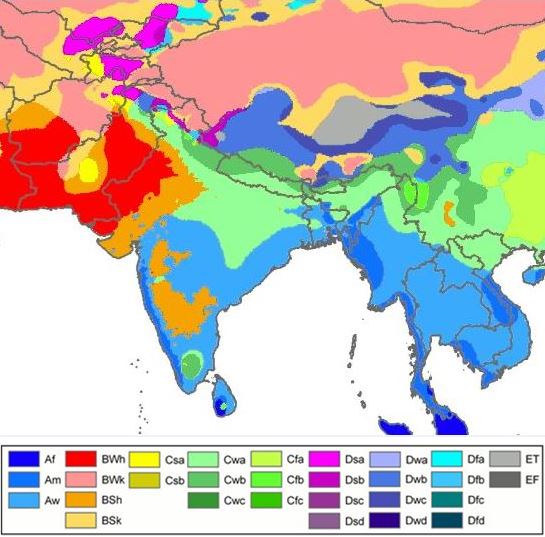
Legend
ライセンス
- あなたは以下の条件に従う場合に限り、自由に
- 共有 – 本作品を複製、頒布、展示、実演できます。
- 再構成 – 二次的著作物を作成できます。
- あなたの従うべき条件は以下の通りです。
- 表示 – あなたは適切なクレジットを表示し、ライセンスへのリンクを提供し、変更があったらその旨を示さなければなりません。これらは合理的であればどのような方法で行っても構いませんが、許諾者があなたやあなたの利用行為を支持していると示唆するような方法は除きます。
- 継承 – もしあなたがこの作品をリミックスしたり、改変したり、加工した場合には、あなたはあなたの貢献部分を元の作品とこれと同一または互換性があるライセンスの下に頒布しなければなりません。
https://creativecommons.org/licenses/by-sa/3.0CC BY-SA 3.0 Creative Commons Attribution-Share Alike 3.0 truetrueExplanatory notes
This map- File-India_and_South_Asia_Köppen_climate_map_with_legend.jpg is cropped from source map File:Köppen World Map (retouched version).png.[1] Some explanations are given below.
Lack of recording stations: Alps, Temperate zone in South India
Extent of Temperate climate markings ( “C” zone) in South India
In map File:Köppen World Map (retouched version).png-The Temperate climate markings ( “C” zone) are larger in Tropical South India, around Kodaikanal which is on the eastern side of Western Ghats mountains in Tamil Nadu state, at a higher elevation (~2300m). And also the temperate climate markings extend further South than expected. This is due to recordings from temperature station at Kodaikanal & lack of recording stations from nearby lowland areas, so markings could not be corrected due to lack of data.[1]
Extent of Alps in Europe marked as E zone; (Himalayas-high mountains- not marked as “E” zone)
In map File:Köppen World Map (retouched version).png-Alps high mountains are marked as “E” zone in this map. But “E” zone markings in the map for the Alps- high mountains do not cover the extent expected, because of lack of recording stations.[1] In this map, Himalayas -high mountains- are not marked as “E” zone.
Another map from a different source, shows no "C" zone in South India, Himalayas high mountains marked as "E" zone
Another map with reliable source is in references list given below. This map is based on data sets from the Climatic Research Unit (CRU) of the University of East Anglia and the Global Precipitation Climatology Centre (GPCC) at the German Weather Service.This is a digital Köppen–Geiger world map[2] on climate classification for the second half of the 20th century.
World Map of the Köppen-Geiger climate classification updated
Kottek 2006 gif map[2]
Kottek 2006 pdf map[2]
This map[2] shows no temperate "C" zone in tropical South India & Himalayas high mountains are marked as polar "E" zone.
References
User Jeroenvrp made for these continents and areas a cropped and resized version:
User LordToran made from the same data these maps:


