
ファイル:NASA NYC VEGETATION.jpg
このプレビューのサイズ: 505 × 599 ピクセル。 その他の解像度: 202 × 240 ピクセル | 404 × 480 ピクセル | 647 × 768 ピクセル | 1,187 × 1,409 ピクセル。
元のファイル (1,187 × 1,409 ピクセル、ファイルサイズ: 940キロバイト、MIME タイプ: image/jpeg)
ウィキメディア・コモンズのファイルページにある説明を、以下に表示します。
|
概要
| 解説 |
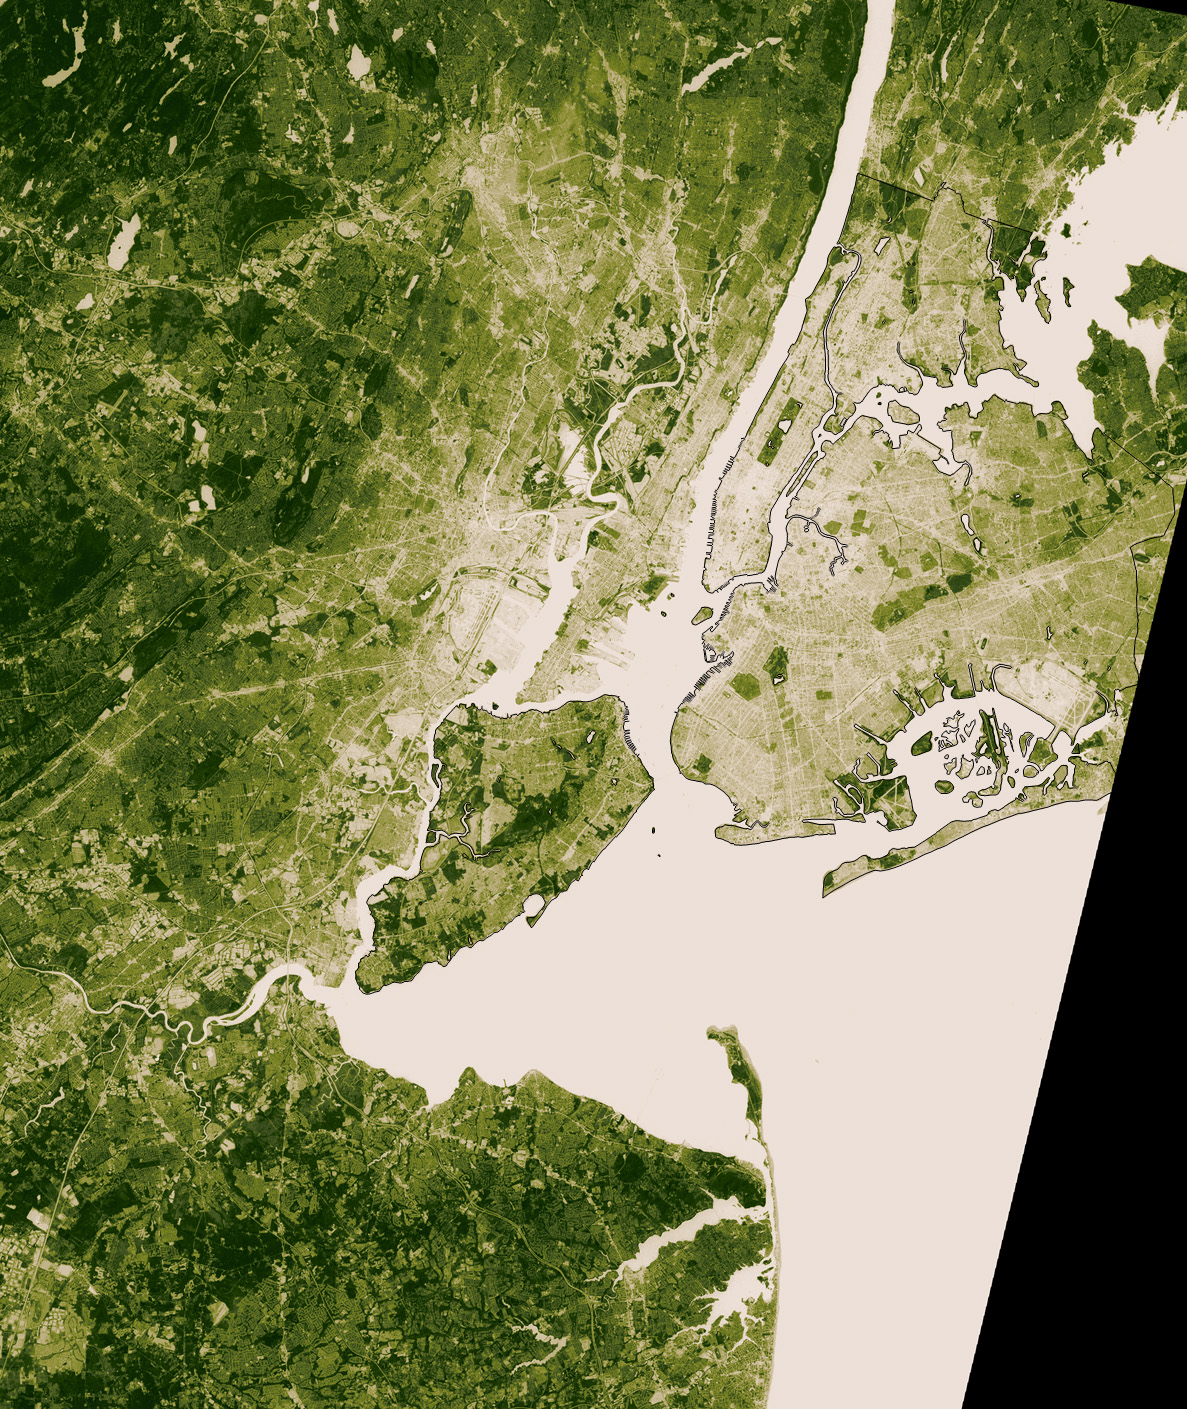
English: This image shows thermal infrared satellite data measured by NASA’s Landsat Enhanced Thematic Mapper Plus on August 14, one of the hottest days in New York?s 2002 summer. Landsat also collected vegetation data. The image shows vegetation from beige (sparse) to deep green (dense). |
| 原典 | [1] |
| 作者 | Image courtesy NASA/GSFC/MITI/ERSDAC/JAROS, and U.S./Japan ASTER Science Team |
ライセンス
| このファイルはアメリカ航空宇宙局(NASA)によって作成されたものです。NASAの著作権の方針では、特記事項が無い場合、NASAの資料はパブリックドメインとなります。 (詳しくはTemplate:PD-USGov、NASAの著作権の方針について(英語)又はジェット推進研究所(JPL)の画像使用に関するガイドライン(英語)をご覧ください。) |
||
 |
注意事項:
|
元のアップロードログ
元のファイルページはこちら。以下の利用者は全てen.wikipediaに属します。
- 2006-08-03 23:52 Wv235 1187×1409×8 (962400 bytes) This image shows thermal infrared satellite data measured by NASA?s Landsat Enhanced Thematic Mapper Plus on August 14, one of the hottest days in New York?s 2002 summer. Landsat also collected vegetation data. The image shows vegetation from beige (s
- 2006-08-03 23:50 Wv235 1187×1409×8 (962400 bytes) This image shows thermal infrared satellite data measured by NASA?s Landsat Enhanced Thematic Mapper Plus on August 14, one of the hottest days in New York?s 2002 summer. Landsat also collected vegetation data. The image shows vegetation from beige (s
- 2006-08-03 23:49 Wv235 1187×1409×8 (962400 bytes) This image shows thermal infrared satellite data measured by NASA?s Landsat Enhanced Thematic Mapper Plus on August 14, one of the hottest days in New York?s 2002 summer. Landsat also collected vegetation data. The image shows vegetation from beige (s
ファイルの履歴
過去の版のファイルを表示するには、その版の日時をクリックしてください。
| 日付と時刻 | サムネイル | 寸法 | 利用者 | コメント | |
|---|---|---|---|---|---|
| 現在の版 | 2007年12月6日 (木) 02:25 | | 1,187 × 1,409 (940キロバイト) | File Upload Bot (Magnus Manske) | {{BotMoveToCommons|en.wikipedia}} {{Information |Description={{en|This image shows thermal infrared satellite data measured by NASA?s Landsat Enhanced Thematic Mapper Plus on August 14, one of the hottest days in New York?s 2002 summer. Landsat also coll |
ファイルの使用状況
以下のページがこのファイルを使用しています:
グローバルなファイル使用状況
以下に挙げる他のウィキがこの画像を使っています:
- en-two.iwiki.icu での使用状況
- id.wikipedia.org での使用状況