
ファイル:Piecharts.svg

この SVG ファイルのこの PNG プレビューのサイズ: 689 × 494 ピクセル. その他の解像度: 320 × 229 ピクセル | 640 × 459 ピクセル | 1,024 × 734 ピクセル | 1,280 × 918 ピクセル | 2,560 × 1,835 ピクセル。
元のファイル (SVG ファイル、689 × 494 ピクセル、ファイルサイズ: 39キロバイト)
ウィキメディア・コモンズのファイルページにある説明を、以下に表示します。
|
概要
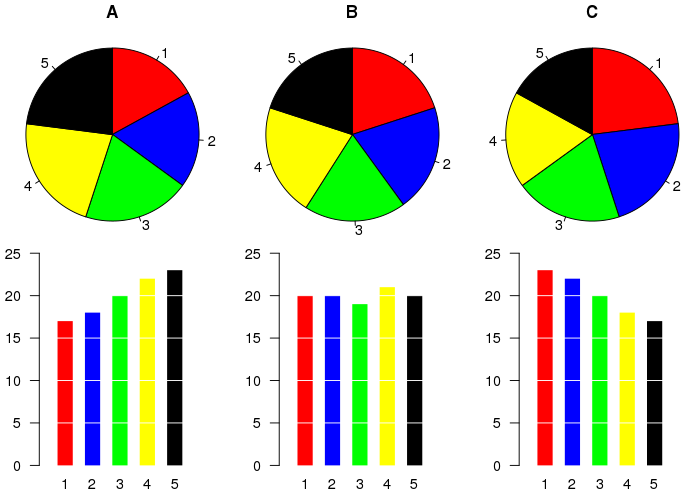
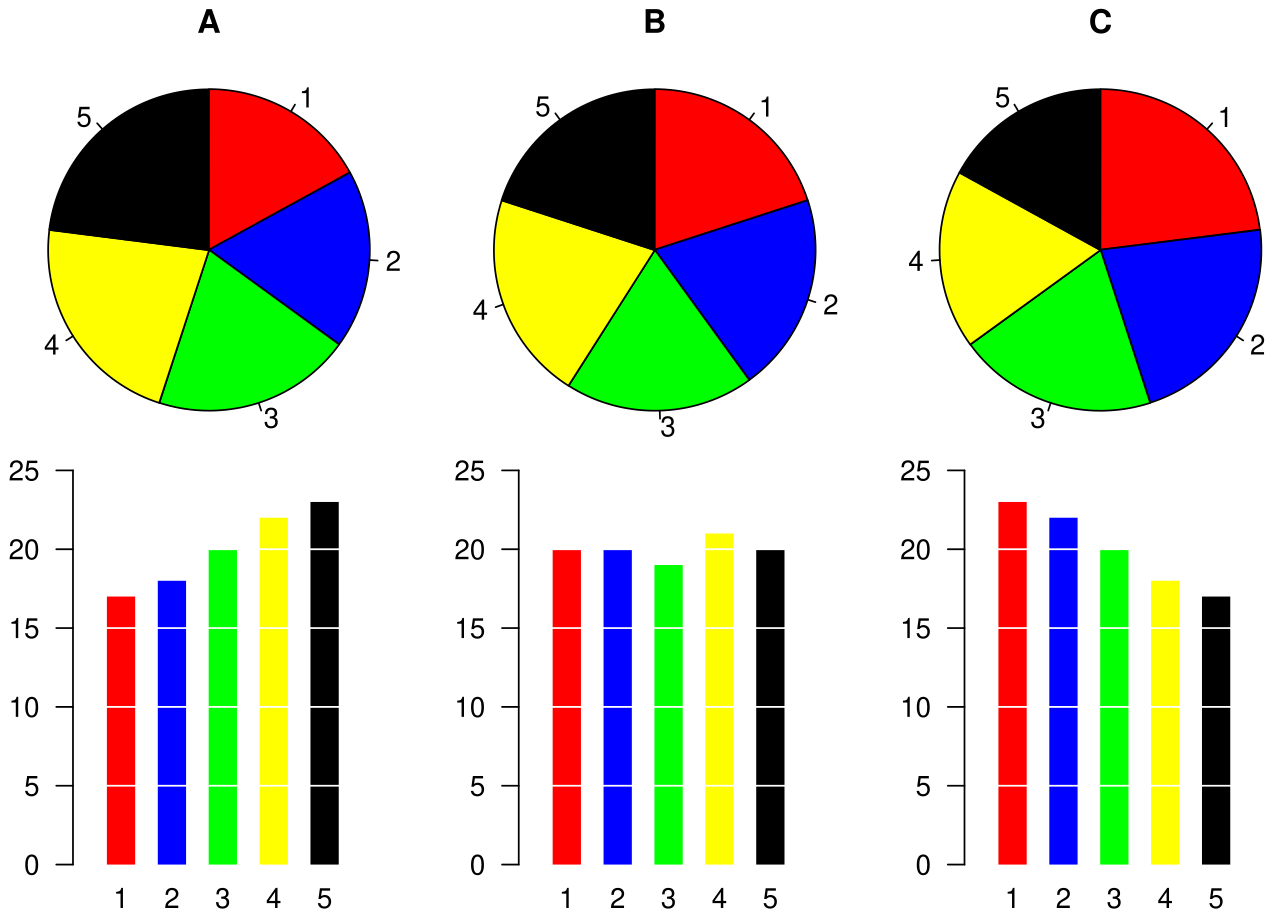
Example of a pie chart, along with a bar plot showing the same data and indicating that the pie chart is not the best possible chart for this particular dataset.
The graphic was created by User:Schutz for Wikipedia on 28 August 2007 using the R statistical project. The program that generated the graphic is given below. The graph was exported in postscript format, converted to SVG using the pstoedit command, and the layout was slightly modified using Inkscape before upload.
ライセンス
このファイルはクリエイティブ・コモンズ 表示 1.0 一般ライセンスのもとに利用を許諾されています。
- あなたは以下の条件に従う場合に限り、自由に
- 共有 – 本作品を複製、頒布、展示、実演できます。
- 再構成 – 二次的著作物を作成できます。
- あなたの従うべき条件は以下の通りです。
- 表示 – あなたは適切なクレジットを表示し、ライセンスへのリンクを提供し、変更があったらその旨を示さなければなりません。これらは合理的であればどのような方法で行っても構いませんが、許諾者があなたやあなたの利用行為を支持していると示唆するような方法は除きます。
ファイルの履歴
過去の版のファイルを表示するには、その版の日時をクリックしてください。
| 日付と時刻 | サムネイル | 寸法 | 利用者 | コメント | |
|---|---|---|---|---|---|
| 現在の版 | 2007年8月28日 (火) 08:33 | | 689 × 494 (39キロバイト) | Schutz | == Summary == Example of a pie chart, along with a bar plot showing the same data and indicating that the pie chart is not the best possible chart for this particular dataset. The graphic was created by User:Schutz for Wikipedia on 28 August 2007 usi |
ファイルの使用状況
以下のページがこのファイルを使用しています:
グローバルなファイル使用状況
以下に挙げる他のウィキがこの画像を使っています:
- cy.wikipedia.org での使用状況
- el.wikipedia.org での使用状況
- en-two.iwiki.icu での使用状況
- eu.wikipedia.org での使用状況
- fi.wikipedia.org での使用状況
- he.wikipedia.org での使用状況
- he.wikibooks.org での使用状況
- pl.wikipedia.org での使用状況
- pt.wikipedia.org での使用状況
- ta.wikipedia.org での使用状況
- tr.wikipedia.org での使用状況
- uk.wikipedia.org での使用状況
- zh-two.iwiki.icu での使用状況