
ファイル:Mental health workers in OECD.svg

この SVG ファイルのこの PNG プレビューのサイズ: 800 × 400 ピクセル. その他の解像度: 320 × 160 ピクセル | 640 × 320 ピクセル | 1,024 × 512 ピクセル | 1,280 × 640 ピクセル | 2,560 × 1,280 ピクセル | 1,440 × 720 ピクセル。
元のファイル (SVG ファイル、1,440 × 720 ピクセル、ファイルサイズ: 128キロバイト)
ウィキメディア・コモンズのファイルページにある説明を、以下に表示します。
|

|
このファイルは、最新の情報を受けて更新される可能性があります。 新しい更新が反映されることなく、特定の版のファイルを使用したい場合は、必要な版を別のファイルとしてアップロードしてください。 |
概要
| 解説 |
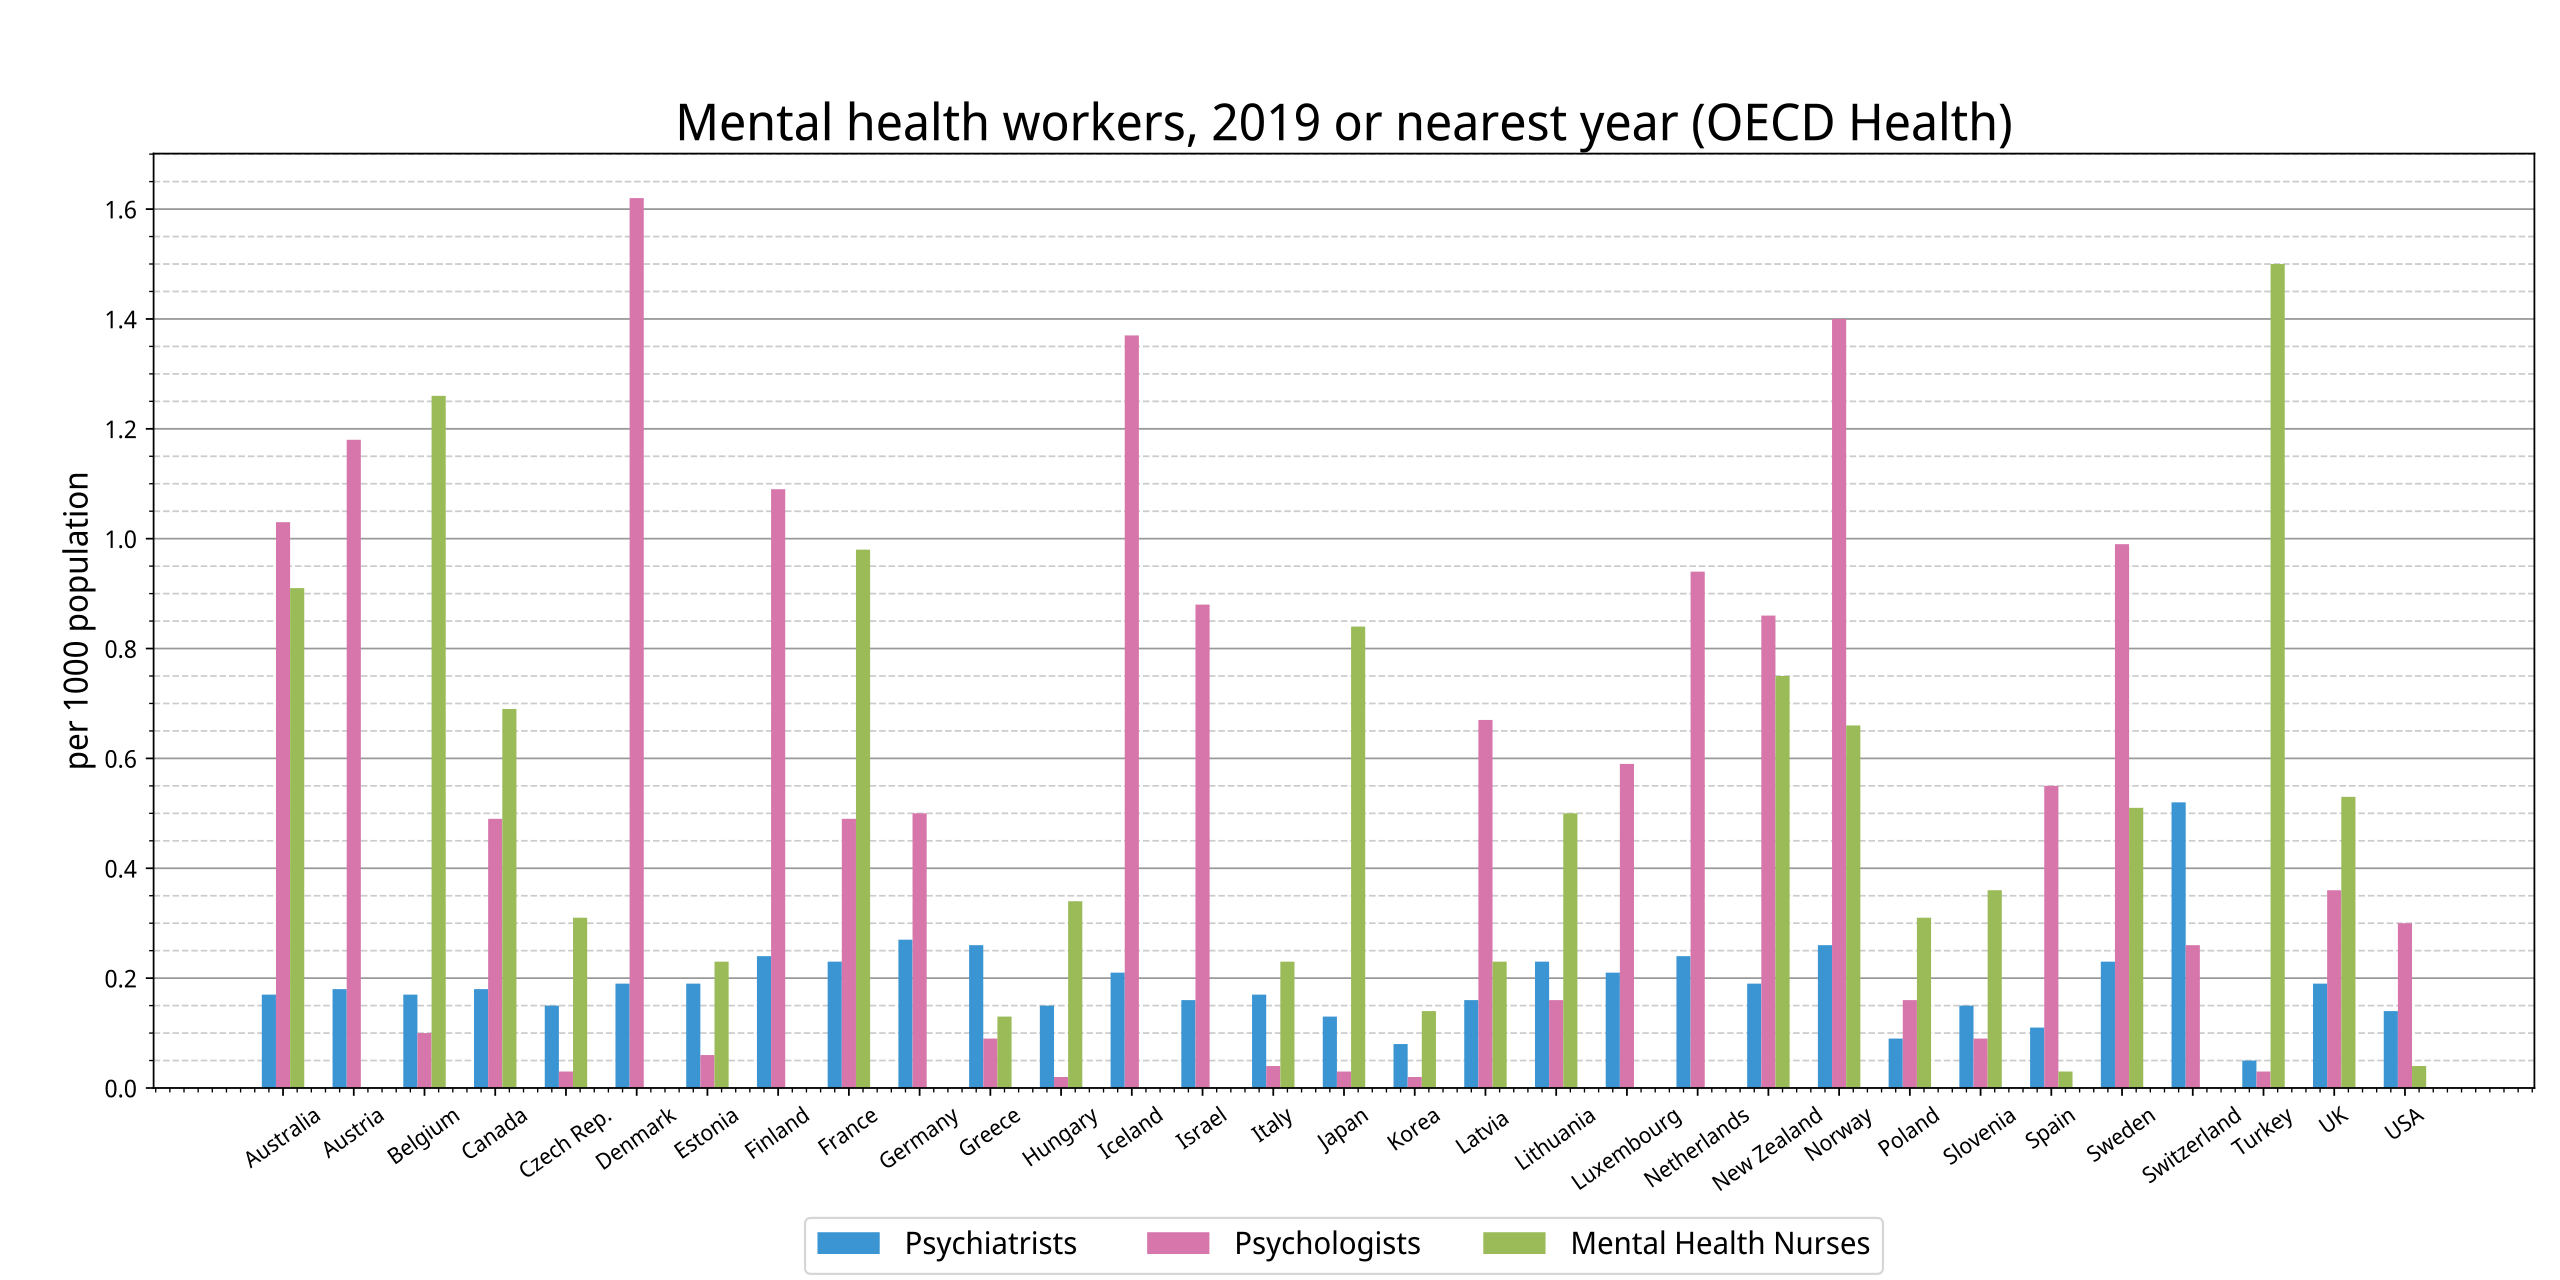
English: Mental Health workers per 100,000 population, 2019(or nearest) |
| 日付 | |
| 原典 |
投稿者自身による著作物 , Data from OECD A New Benchmark for Mental Health Systems: Tackling the Social and Economic Costs of Mental Ill-Health https://doi.org/10.1787/4ed890f6-en. |
| 作者 | Yuasan |
| 許可 (ファイルの再利用) |
CC-0 |
ライセンス
この作品の著作権者である私は、この作品を以下のライセンスで提供します。
| このファイルはクリエイティブ・コモンズ CC0 1.0 全世界 パブリック・ドメイン提供のもとで利用可能にされています。 | |
| ある作品に本コモンズ証を関連づけた者は、その作品について世界全地域において著作権法上認められる、その者が持つすべての権利(その作品に関する権利や隣接する権利を含む。)を、法令上認められる最大限の範囲で放棄して、パブリック・ドメインに提供しています。
この作品は、たとえ営利目的であっても、許可を得ずに複製、改変・翻案、配布、上演・演奏することが出来ます。 |
Graph Data
import matplotlib.pyplot as plt
import pandas as pd
import numpy as np

df = pd.read_csv("data.tsv", index_col=0 , sep = "\t")

fig, ax = plt.subplots(figsize=(16, 8))
x = np.arange(df.index.size)
ax.bar(x-0.2, df["Psychiatrists "] , color="#3b95d3", width=0.2, bottom=0)
ax.bar(x, df["Psychologists"] , color="#D676AB", width=0.2, bottom=0)
ax.bar(x+0.2, df["Mental Health Nurses"] , color="#9BBB59", width=0.2, bottom=0)

ax.legend(df.columns, fontsize=14, ncol=3, loc='center' ,bbox_to_anchor=(0, -0.22, 1., .102) )

ax.set_axisbelow(True)

plt.rcParams['font.family'] = 'sans-serif'
plt.rcParams['font.sans-serif'] = ['Noto Sans Display']
plt.subplots_adjust(left=0.06, bottom=0.15, right=0.99, top=0.9)

plt.title("Mental health workers, 2019 or nearest year (OECD Health)", fontsize=23)
plt.tick_params(labelsize=10, pad=4)
plt.xticks(x, df.index, rotation=35, size=10)

plt.ylabel("per 1000 population", size=15)
plt.yticks(fontsize=11)

ax.minorticks_on()
plt.grid(which='major',color='#999999',linestyle='-', axis="y")
plt.grid(which='minor',color='#cccccc',linestyle='--', axis="y")
plt.subplots_adjust(top =0.88)

plt.savefig("image.svg")
ファイルの履歴
過去の版のファイルを表示するには、その版の日時をクリックしてください。
| 日付と時刻 | サムネイル | 寸法 | 利用者 | コメント | |
|---|---|---|---|---|---|
| 現在の版 | 2022年12月12日 (月) 12:51 | | 1,440 × 720 (128キロバイト) | Yuasan | 2019 data |
| 2015年2月16日 (月) 04:29 |  | 743 × 401 (79キロバイト) | Yuasan | User created page with UploadWizard |