
ファイル:Revenue of Japan Government.svg

この SVG ファイルのこの PNG プレビューのサイズ: 800 × 400 ピクセル. その他の解像度: 320 × 160 ピクセル | 640 × 320 ピクセル | 1,024 × 512 ピクセル | 1,280 × 640 ピクセル | 2,560 × 1,280 ピクセル | 900 × 450 ピクセル。
元のファイル (SVG ファイル、900 × 450 ピクセル、ファイルサイズ: 134キロバイト)
ウィキメディア・コモンズのファイルページにある説明を、以下に表示します。
|

|
このファイルは、最新の情報を受けて更新される可能性があります。 新しい更新が反映されることなく、特定の版のファイルを使用したい場合は、必要な版を別のファイルとしてアップロードしてください。 |
概要
| 解説 |
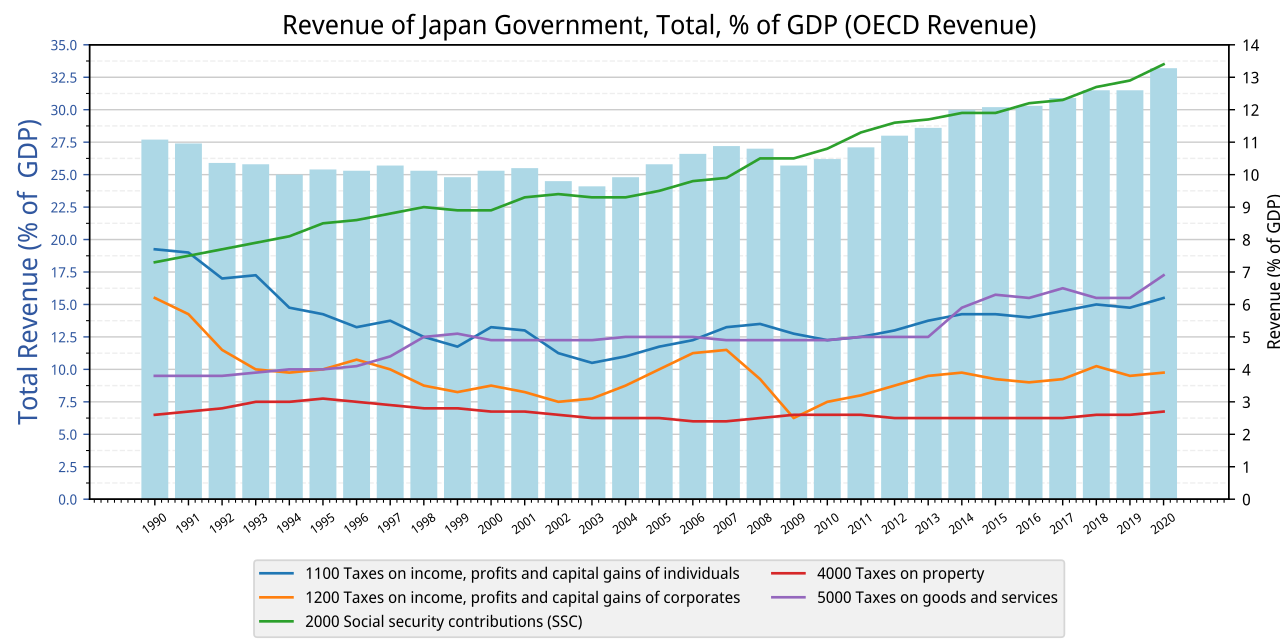
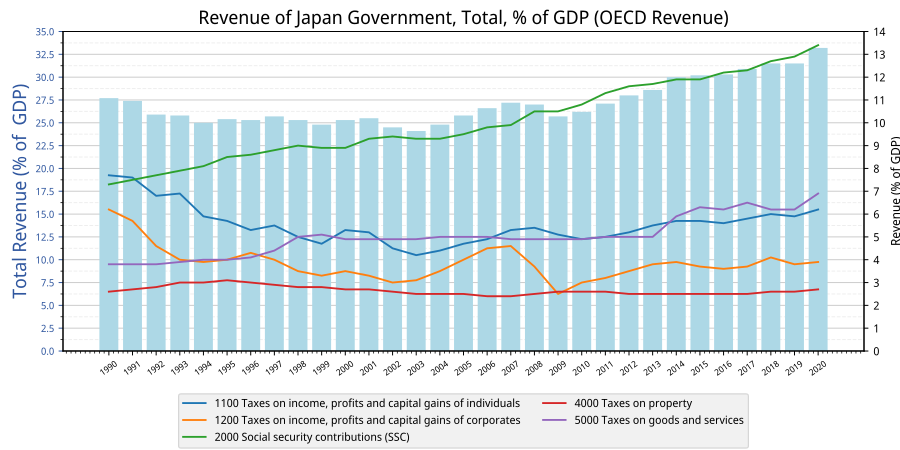
English: Revenue of Japan Government, Total, % of GDP |
| 日付 | |
| 原典 |
投稿者自身による著作物, Data from OECD. https://stats.oecd.org/Index.aspx?DataSetCode=RS_GBL |
| 作者 | Yuasan |
| 許可 (ファイルの再利用) |
CC-0 |
Graph data
import matplotlib.pyplot as plt
from cycler import cycler
import pandas as pd
import matplotlib.ticker as ticker

df = pd.read_csv("data.tsv", index_col=0 , sep = "\t")
df1 = df.filter(like='00',axis=0).T
df2 = df.loc['Total tax revenue'].T


fig, ax = plt.subplots(figsize=(10, 5))
ax2 = ax.twinx()
plt.rcParams['font.family'] = 'sans-serif'
plt.rcParams['font.sans-serif'] = ['Noto Sans Display']
plt.subplots_adjust(left=0.07, bottom=0.22, right=0.96, top=0.93)
plt.setp(ax.get_xticklabels(), fontsize=7)
plt.setp(ax.get_yticklabels(), fontsize=8)


ax.bar(df2.index, df.loc['Total tax revenue'].T, color="lightblue")
ax.set_ylim([0,35])
ax.set_axisbelow(True)
ax.tick_params(axis='x', labelrotation=35)
ax.set_ylabel("Total Revenue (% of  GDP)", fontsize=15, color="#30579f")
ax.tick_params(axis='y', colors='#30579f')

ax2.set_prop_cycle( plt.rcParams['axes.prop_cycle'] )
ax2.plot(df1)
ax2.set_ylim([0,14])
ax2.legend(df1.columns, fontsize=9, ncol=2, loc='center' ,bbox_to_anchor=(0., -0.27, 1., 0.102) ,facecolor="#eeeeee" )
ax2.set_ylabel("Revenue (% of GDP)", fontsize=10)


plt.title("Revenue of Japan Government, Total, % of GDP (OECD Revenue)", fontsize=15)
plt.tick_params(labelsize=9, pad=4)
plt.grid(which='major',color='#cccccc',linestyle='-', axis="y")

ax.minorticks_on()
ax.yaxis.set_major_locator(ticker.MultipleLocator(2.5))
ax.yaxis.set_minor_locator(ticker.MultipleLocator(1.25))
ax.grid(False, which='minor', axis="x")
ax.grid(True, which='major',color='#cccccc',linestyle='-', axis="y")
ax.grid(True, which='minor',color='#eeeeee',linestyle='--', axis="y")
ax2.yaxis.set_major_locator(ticker.MultipleLocator(1))
ax2.grid(False, which='both', axis="both")

plt.savefig("image.svg")
ライセンス
この作品の著作権者である私は、この作品を以下のライセンスで提供します。
| このファイルはクリエイティブ・コモンズ CC0 1.0 全世界 パブリック・ドメイン提供のもとで利用可能にされています。 | |
| ある作品に本コモンズ証を関連づけた者は、その作品について世界全地域において著作権法上認められる、その者が持つすべての権利(その作品に関する権利や隣接する権利を含む。)を、法令上認められる最大限の範囲で放棄して、パブリック・ドメインに提供しています。
この作品は、たとえ営利目的であっても、許可を得ずに複製、改変・翻案、配布、上演・演奏することが出来ます。 |
ファイルの履歴
過去の版のファイルを表示するには、その版の日時をクリックしてください。
| 日付と時刻 | サムネイル | 寸法 | 利用者 | コメント | |
|---|---|---|---|---|---|
| 現在の版 | 2023年7月8日 (土) 11:14 | | 900 × 450 (134キロバイト) | Yuasan | 2020 data |
| 2021年10月18日 (月) 13:13 |  | 1,080 × 720 (94キロバイト) | Yuasan | Uploaded own work with UploadWizard |