
ファイル:Scatter plot.jpg
高解像度版はありません。
Scatter_plot.jpg (500 × 500 ピクセル、ファイルサイズ: 40キロバイト、MIME タイプ: image/jpeg)
ウィキメディア・コモンズのファイルページにある説明を、以下に表示します。
|
概要
| 解説 |
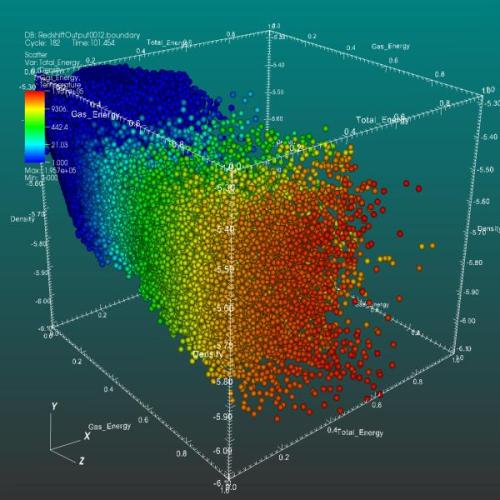
English: Scatter plot
VisIt's Scatter plot allows for the visualization of multivariate data of up to four dimensions. The Scatter plot takes multiple scalar variables and uses them for different axes in phase space. The different variables are combined to form coordinates in the phase space and they are displayed using glyphs and colored using another scalar variable. |
| 日付 | Updated: November 8, 2007 |
| 原典 | Visualizations that have been created with VisIt. at wci.llnl.gov |
| 作者 | UCRL |


ライセンス
このファイルは、アメリカ合衆国の連邦政府と雇用関係にある公務員がその職務上作成したアメリカ合衆国政府の著作物であり、アメリカ合衆国の著作権法上パブリックドメインに属します (17 U.S.C. §105)。
注意:このライセンスは、アメリカ合衆国政府の著作物についてのみ効力を有します。アメリカ合衆国の各州、郡、その他の地方自治体が作成した著作物に対しては適用できません。
|
 | |
| このファイルは著作権法の既知の制約(隣接権や関連する権利を含む)から自由であると特定されています。 | ||
ファイルの履歴
過去の版のファイルを表示するには、その版の日時をクリックしてください。
| 日付と時刻 | サムネイル | 寸法 | 利用者 | コメント | |
|---|---|---|---|---|---|
| 現在の版 | 2008年7月10日 (木) 22:34 | | 500 × 500 (40キロバイト) | Mdd | {{Information |Description={{en|1=Scatter plot VisIt's Scatter plot allows you to visualize multivariate data of up to four dimensions. The Scatter plot takes multiple scalar variables and uses them for different axes in phase space. The different variab |
ファイルの使用状況
グローバルなファイル使用状況
以下に挙げる他のウィキがこの画像を使っています:
- ar.wikipedia.org での使用状況
- bn.wikipedia.org での使用状況
- ca.wikipedia.org での使用状況
- de.wikipedia.org での使用状況
- en-two.iwiki.icu での使用状況
- en.wikiversity.org での使用状況
- et.wikipedia.org での使用状況
- eu.wikipedia.org での使用状況
- fa.wikipedia.org での使用状況
- gl.wikipedia.org での使用状況
- id.wikipedia.org での使用状況
- it.wikipedia.org での使用状況
- pt.wikipedia.org での使用状況
- ro.wikipedia.org での使用状況
- ru.wikipedia.org での使用状況
- simple.wikipedia.org での使用状況
- sl.wikipedia.org での使用状況
- sr.wikipedia.org での使用状況
- sv.wikipedia.org での使用状況
- uk.wikipedia.org での使用状況
- zh-two.iwiki.icu での使用状況