
ファイル:Timeline of weekly confirmed COVID-19 deaths in the United States.svg

この SVG ファイルのこの PNG プレビューのサイズ: 800 × 565 ピクセル. その他の解像度: 320 × 226 ピクセル | 640 × 452 ピクセル | 1,024 × 723 ピクセル | 1,280 × 904 ピクセル | 2,560 × 1,807 ピクセル。
元のファイル (SVG ファイル、850 × 600 ピクセル、ファイルサイズ: 72キロバイト)
ウィキメディア・コモンズのファイルページにある説明を、以下に表示します。
|
概要
| 解説 |
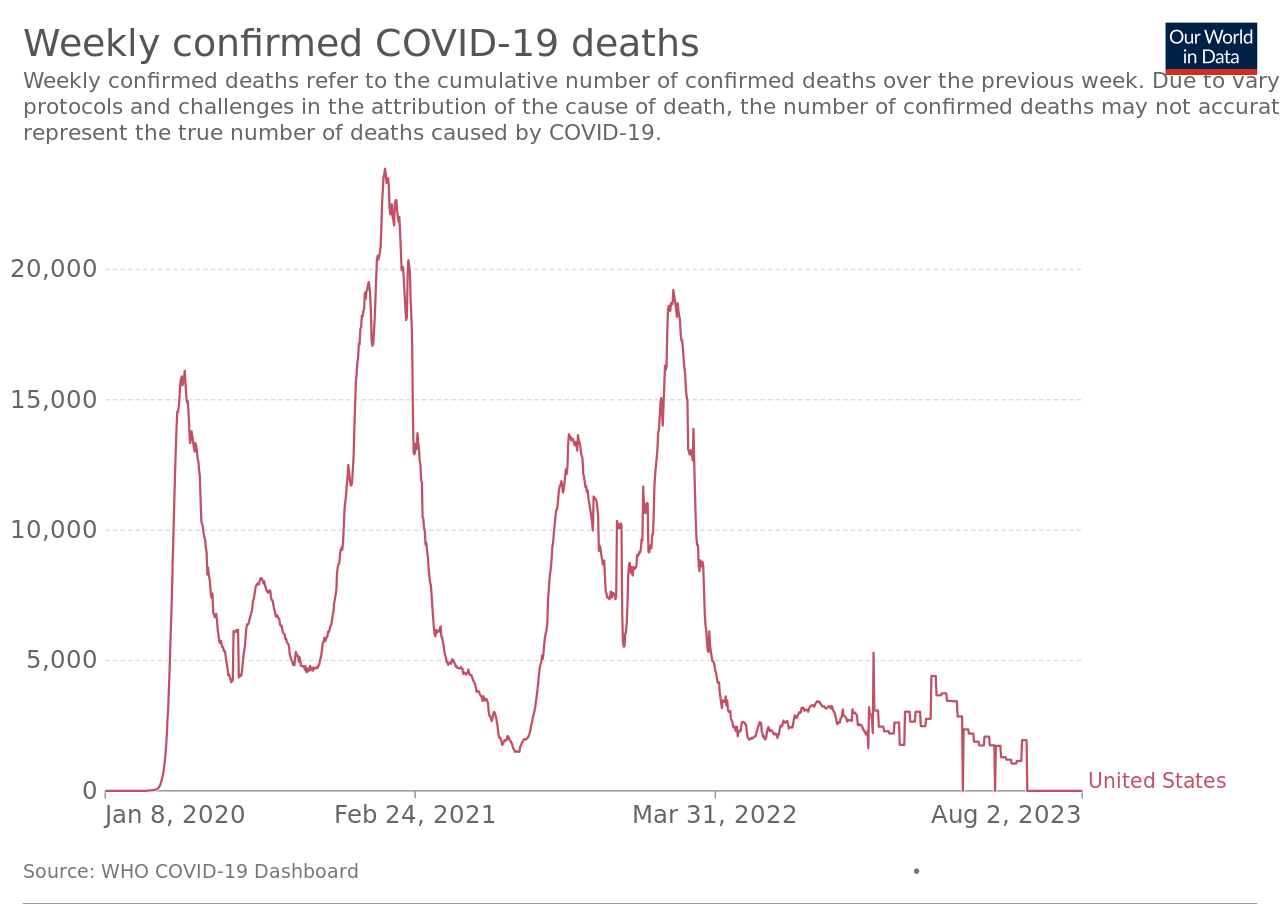
English: Timeline of weekly confirmed COVID-19 deaths in the United States. See end date on graph. Go to the source link below. The graph at the source is interactive and provides more detail. For example, run your cursor over the graph for the date and weekly count. The sources tab there links to: COVID-19 Data Repository by the Center for Systems Science and Engineering (CSSE) at Johns Hopkins University. The table tab has weekly numbers by country. |
| 日付 | is the date of the first upload to the Commons. See the file history below for the most recent upload date. Please upload new versions. Use the upload link at the end of the file history list. |
| 原典 | 次のものを使用した投稿者自身による著作物:: https://ourworldindata.org/grapher/weekly-covid-deaths?tab=chart&country=~USA - Click on the download tab. |
| 作者 | Our World In Data. See Wikipedia: Our World in Data. |
| SVG 開発 |
ライセンス
このファイルはクリエイティブ・コモンズ 表示 4.0 国際ライセンスのもとに利用を許諾されています。
- あなたは以下の条件に従う場合に限り、自由に
- 共有 – 本作品を複製、頒布、展示、実演できます。
- 再構成 – 二次的著作物を作成できます。
- あなたの従うべき条件は以下の通りです。
- 表示 – あなたは適切なクレジットを表示し、ライセンスへのリンクを提供し、変更があったらその旨を示さなければなりません。これらは合理的であればどのような方法で行っても構いませんが、許諾者があなたやあなたの利用行為を支持していると示唆するような方法は除きます。
ファイルの履歴
過去の版のファイルを表示するには、その版の日時をクリックしてください。
| 日付と時刻 | サムネイル | 寸法 | 利用者 | コメント | |
|---|---|---|---|---|---|
| 現在の版 | 2023年8月8日 (火) 21:58 | | 850 × 600 (72キロバイト) | Timeshifter | latest |
| 2023年5月19日 (金) 03:06 |  | 850 × 600 (69キロバイト) | Timeshifter | Latest | |
| 2023年2月12日 (日) 22:58 |  | 850 × 600 (63キロバイト) | Timeshifter | Latest | |
| 2023年1月14日 (土) 04:58 |  | 850 × 600 (61キロバイト) | Timeshifter | Latest graph | |
| 2023年1月5日 (木) 06:55 |  | 850 × 600 (61キロバイト) | Timeshifter | latest graph from source. | |
| 2022年12月11日 (日) 15:08 |  | 850 × 600 (60キロバイト) | Timeshifter | latest graph from source. | |
| 2022年11月21日 (月) 23:54 |  | 850 × 600 (60キロバイト) | Timeshifter | latest graph from source. | |
| 2022年10月23日 (日) 10:31 |  | 850 × 600 (58キロバイト) | Timeshifter | latest graph from source. | |
| 2022年10月6日 (木) 23:40 |  | 850 × 600 (58キロバイト) | Timeshifter | latest graph from source. | |
| 2022年8月23日 (火) 11:24 |  | 850 × 600 (56キロバイト) | Timeshifter | Latest graph from source |
ファイルの使用状況
以下のページがこのファイルを使用しています:
グローバルなファイル使用状況
以下に挙げる他のウィキがこの画像を使っています:
- en-two.iwiki.icu での使用状況
- pl.wikipedia.org での使用状況
- zh-two.iwiki.icu での使用状況