
利用者:Jrwest221/sandbox
 |
ここはJrwest221さんの利用者サンドボックスです。編集を試したり下書きを置いておいたりするための場所であり、百科事典の記事ではありません。ただし、公開の場ですので、許諾されていない文章の転載はご遠慮ください。
登録利用者は自分用の利用者サンドボックスを作成できます(サンドボックスを作成する、解説)。 この利用者の下書き:User:Jrwest221/sandbox・User:Jrwest221/下書き1・User:Jrwest221/下書き2・User:Jrwest221/下書き3 その他のサンドボックス: 共用サンドボックス | モジュールサンドボックス 記事がある程度できあがったら、編集方針を確認して、新規ページを作成しましょう。 |


ニューヨーク市地下鉄の路線図は、1904年の地下鉄の開業以来更新されている。もともと3つの異なる会社によって建設されたため、すべての地下鉄路線の路線図は、3つの会社が1つの事業者に統合された1940年まで作成されなかった。それ以来、改訂を重ねている。
現在のニューヨーク市地下鉄の路線図は、1979年に発表されたデザインに由来している。この路線図は、メトロポリタン・トランスポーテーション・オーソリティ(MTA)のマーケティングおよびコーポレートコミュニケーション部門の管理下で徐々に進化してきた。ジョン・タウラナックが議長を務めるMTA地下鉄路線図委員会によって作成されました。この委員会は、地図のデザインをマイケル・ヘルツ・アソシエイツに委託しました。
MTAは、2020年に、Work&Co[1]によって設計および構築されたデジタルデバイス用の地図をリリースしました。ライブ地下鉄路線図は、マッシモヴィネッリの図とハーツによる設計の要素を組み合わせており、リアルタイムのサービス更新のためにライブデータベースに接続します[2]。
初期の路線図
[編集]
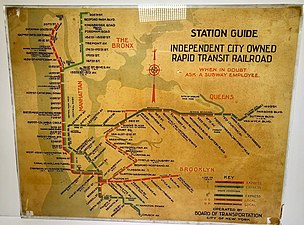
1904年に開業オープンしたインテーボロー・ラピッド・トランジット (IRT) の地図には、地下鉄ルートと高架ルートが示されていました[3] 。ただし、IRTの路線図には、ブルックリン-マンハッタン・トランジット・コーポレーション(BMT)の路線は表示されませんでした。 逆に、IRTとBMTの間のデュアルコントラクトの後でも、BMTの路線図にはIRTの路線が表示されませんでした[4] 。実際、IRT、BMT、インディペンデント・サブウェイ・システム(IND)が1つのエンティティに統合される前の1939年でも、民間企業による地図は1つの会社のルートのみを示して印刷されていました[4] [5]。地下鉄3社も独自の地図を公開し、独自のルートを示しています[5]。
ルートは1958年まで地下鉄路線図で互いに区別されていませんでした[4] 。最初のルートマップは見た目には美しいものでしたが、現在の図よりも地理的に不正確であるという認識がありました。1972年から1979年の間にMTAによって発行されたマッシモヴィネッリによる地下鉄地図のデザインは、それ以来、デザイン界でモダンクラシックとして認識されるようになりました。ただし、MTAは、地理的要素の配置が原因で、特に要素が水平、垂直、または斜めにのみ実行されるという意味で、マップに欠陥があると見なしました。 対照的に、1979年にヴィネッリのデザインに取って代わったハーツマップには、以前の3つのシステムのニュアンスと複雑さを明確にしながら、より湾曲した「有機的な外観」の要素が含まれていました。 Michael Hertzによって最初に作成されたHertzのデザインは、それ以降の地下鉄の拡張を反映して、いくつかのスタイルの違いと更新を加えて使用され続けています。[6][7]
1985年、地下鉄が2文字のルートを廃止したことで、地図も大幅に変更されました。 マップ上のルートは直線的ではなくなり、より円形になりました。これは、今日でも維持されている設計です。 「幹線」は、以前のヴィネッリの地図に表示されていた多色のルートではなく、1色に再配置されました[4]。
路線図の広がり
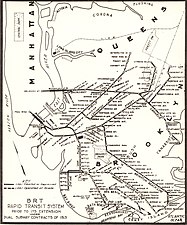
[編集]ニューヨーク市の地下鉄の建設が提案されていない拡張のルートを示す2つの地図が描かれました。1つは1929年、もう1つは1939年です[8] 。1970年代には、拡張された地下鉄システムの計画されたサービスパターンを示すために地下鉄路線図も作成されました。 この地図は、1968年の行動計画で提案されたいくつかの地下鉄路線の完成時に可能なサービスパターンを示しました[9]。
統一された路線図
[編集]1940–56年: 会社ごとの路線図
[編集]1940年7月に地下鉄運営会社が運輸局に買収された後、1942年まで個々の会社の特徴的なスタイルで地図が発行され続けた。 このように、IRT部門は旧IRT会社のスタイルで地図を発行し、BMT部門は旧BMT会社のスタイルで地図を発行しました[10] 。しかし、統合された設計にするために、理事会は外部で作成された地図を持ち込みました。 1943年から1952年にかけて、理事会はAndrew Hagstromの地図の在庫を購入し、理事会のサービス情報をオーバープリントし、トークンブースから事実上の公式地図として発行しました。 (例: 1948年[11])
1953年、ニューヨーク・シティ・トランジット・オーソリティ(NYCTA)が運輸局から地下鉄を引き継ぎました。 彼らは1956年まで公式地図としてHagstrom地図を発行し続けましたが、2つの変更を開始しました。 最初に:1954年以降、彼らはStephen Voorhiesによって設計され、UnionDimeBankの販促資料が印刷された地下鉄路線図の在庫を取得しました。 これは、Voorhiesマップが無料で、Hagstromが料金を請求したため、お金を節約するために行われました。 出版物を有効に保つために、NYCTAは定期的に更新されたサービス情報をHagstromとVoorhiesの両方に送信し、サービステーブルに印刷し、必要に応じてマップに組み込みました。 第二に、NYCTAは、社内の地図デザインを作成して費用を節約し、地図をより詳細に管理するための提案を求めました。
1958年: ジョージ・サロモンによる改訂
[編集]
1955年、ジョージサロモンは、地図だけでなく命名法のシステム全体を再設計するという提案をNYCTAに提出しました[12] 。サロモンはドイツのエミグレであり、彼が提案したルート名と色のシステムは、ベルリンのUバーンのシステムを反映しています。 彼はまた、イギリスでエリック・ギルの下で1年間勉強し、ロンドン地下鉄路線図に賞賛を表明しました。 彼の地図は、ハリーベックのロンドンの地図と同じモダニズム様式を採用しており、図式形式の体系的な視覚言語に従ったニューヨーク市の地下鉄の最初の地図でした。 NYCTAは、命名法の体系的な改訂を拒否しましたが、1958年から1967年までの公式地図として彼の線図を使用しました[13]。
1958年に地図を配信した後、Salomonはそれを制御できなくなり、1964年の地図などのミニマリストデザインにNYCTAが観光情報を追加することを嫌いました[14][15]。
1967年: クリスティー・ストリート・コネクションによる改訂
[編集]
地下鉄システムのボトルネックを解消するために、1960年代に一連の主要な作業が実施されました。そのうちの1つ、マンハッタンのチャイナタウンにある2マイル(3.2 km)のクリスティストリートコネクションは、地下鉄のBMTとINDの区分を統合し、3色のネットワークマップを廃止したため、地下鉄の地図に大きな影響を与えました。それは1930年代から使用されていました。交通局は、クリスティーストリートコネクションが開通するまでに新しい地図のデザインを考案する必要があったため、1964年に地下鉄地図コンペティションを一般公開しました。 3人の勝者がいました。そのうちの1人であるR.RaleighD'Adamoは、彼の地図とともに説明レポートを提出しました。このレポートには、歴史的な運営会社ではなく、個々のルートで地下鉄を色分けするという革新的な提案が詳しく説明されています。このコンセプトは、TAのコンサルタントとして働いているホフストラ大学のDr. Stanley Goldsteinと、地下鉄路線図を印刷した会社であるDiamondPackagingのアートディレクターであるDanteCaliseによって実装されました。 1967年11月26日、新しい接続が開かれたときに、新しいマップが使用されるようになりました[4]。新しくルート変更されたすべてのサービスを説明するマップもありました[14]。
1972年: マッシモ・ヴィネッリによる改訂
[編集]1967年にリリースされたTAの新しい地図は、ローリー・ダダモの色分けの原則を初めて使用しましたが、ヴィネッリが「断片化」と呼んだものに苦しみ、評判が良くありませんでした。 翌年、TAの上に親組織であるメトロポリタン・トランスポーテーション・オーソリティ(MTA)が設立され、この新しい組織のモダンなブランドイメージを作成したいと考えていたウィリアムJ.ロナンが議長を務めました。 ユニマークサイネージプロジェクトがニューヨークシティトランジットオーソリティグラフィックススタンダードマニュアルの作成でまだ完成している間に、ヴィネッリはロウアーマンハッタンの地図の一部のモックアップを持ってローナンに行きました[15]。 Ronanはそれを承認し、1970年7月にTAはUnimarkに新しいシステムマップを設計する契約を与えました。
彼の地図は、ヴィネッリの設計指示の下、ジョアン・チャリシンによってユニマークオフィスにまとめられました。 1971年4月、ヴィネッリはユニマークを離れ、妻でありビジネスパートナーでもあるレラヴィネッリと一緒にヴィネッリアソシエイツを設立しました。この時点で、地図はほぼ完成していましたが、現在MTAの検査およびレビュー局の責任者であるRaleighD'Adamoによって要求された修正および修正の対象となりました。これらの変更は、地図の印刷も監督したCharysynによって実行されました。このプロジェクト中のユニマークとMTAとの連絡は、ノーバート・オーラーが担当しました。この地図は、1972年8月4日、57番街と6番街の駅で行われた式典でロナンによって発表されました。次の週末から、地図は駅や地下鉄の車に設置され始めました。マップは8月7日にライダーのトークンブースで利用可能になりました[16]。作成には105,000ドルかかりました。地図とともに、地下鉄のディレクトリが公開されました。この特定のものは、アルファベット順のリストで、57番街からシステム内の他の地下鉄駅に行く方法を示しました[17]。
1972年に地図の機械が引き渡された後、ヴィネッリは地図をそれ以上制御できなくなりました。 1973年から1978年にかけてさらに6つのエディションが作成され、大幅な変更が加えられました[要出典] 。絶賛されましたが、地下鉄の地図は多くのライダーに人気がないことがわかりました[18]。 1974年、ウィリアム・ローナンはMTAの会長としてデビッド・ユニッチに代わりました。 ユニッチは元メイシーズのデパートの幹部であり、地下鉄をライダーに「売る」という明確な意図を持っていました。 彼は、1975年にヴィネッリに代わる新しい地図を設計するために地下鉄地図委員会を結成したメイシーズのフレッドウィルキンソンから引き継いだ。
1978年: ジョン・トーラナックとマイケル・ヘルツ・アソシエイトによる改訂
[編集]1976年の終わりに、ウィルキンソンはトランジットからサーフェスオペレーションの執行役員に任命され、地下鉄地図委員会を辞任しました[19]。半年間、委員会は会合しませんでした。そして1977年の夏、ジョン・タウラナックが委員会の委員長に任命され、会議が再開されました[20]。委員会は、デザイン会社Michael Hertz Associatesと協力してデザインを実験し、1978年2月、タウラナックは、CityanaGalleryが運営するCityanaGalleryで、「The Good、The Bad ... The Better?A New York CitySubwayMapRetrospective」というタイトルの展示会を開催しました。委員会の最新のプロトタイプマップを展示し、世論の反応をテストするための質問票を提供するベンジャミンブロム[21]。訪問者は、地理情報は気に入ったが、すべての地下鉄路線に単一の色を使用することは嫌いだと述べました[22]。これに応じて、タウラナックは2色のバージョンを用意しました。以前のIRTラインには青、以前のBMTおよびINDラインには赤です。これは、タウラナックが2つの地図作成学校間の公の戦いでマッシモ・ヴィネッリと討論した4月のクーパーユニオンで展示されました[23]。最終的な設計では、共通の幹線または「幹線」回線で実行されているサービスが同じ色を共有する幹線色のスキームを使用しました[24][25]。
タウラナックは、TAスタッフと一般市民、およびMichaelHertzAssociatesの3人のスタッフで構成される12人の地下鉄路線図委員会を率いました[26][27][28] 。全員が最終的なデザインに貢献し、地図は一人の個人によってデザインされたとは言えません[29] 。ニューヨークタイムズ紙によると、彫刻家で画家のノブユキ「ノブ」シライシは新しいバージョンの地図のスケッチを描き、心理学者のアーラインブロンザフトは新旧の地図に対するライダーの反応を判断するための調査を実施しました[30] 。Siraisi rode all of the routes with his eyes closed in order to feel each track curve, which he then drew in a sketchbook. The curves in Siraisi's drawings helped to alleviate a feeling of disorientation that many riders felt when looking at the straight lines of the Vignelli map, as had been observed in Bronzaft's studies.[25] The final assignment of colors was made by Tauranac.[31]
The extant minutes of the Subway Map Committee show that Tauranac was responsible for several major design decisions—such as the use of a geographic style, the use of trunk-based color coding, the use of route markers, and the appearance of transfer stations. He also organized and coordinated the contributions of everybody in the group and liaised with TA and MTA staff to get approvals and funding and then to ensure that all the station and car signs in the subway network were changed to match the color scheme of the new map when it was launched.[要出典] In September 1978, Tauranac met with Phyllis Cerf Wagner, head of the MTA Aesthetics Committee, and told her that the map project was "dead in the water" because he could not make the map he wanted, since there was no funding to change to signage to match the change in the map. Cerf Wagner was subsequently able to secure the funds.[32]
In June 1979 the finished subway map was published in time for the Diamond Jubilee, the subway's 75-year anniversary.[33] Paul Goldberger praised the map as "the clearest and most usable map the subway system has had in years", and one of the bright spots of the subway system, which was then in poor condition.[34] A New York Times editorial said, "Not all the news about New York's subways is bad", praising the production of a "readable subway map".[35] Tauranac defended his design in public debates with Massimo Vignelli in April 1978 and December 2010.[要出典]
その後のトーラナックとヘルツによる改訂
[編集]Initially, there was only an English-language version of the map. In 1991, a multilingual version of the map was printed in six languages commonly used by tourists: English, Spanish, French, German, Italian, and Japanese.[36] Additionally, Staten Island was initially not shown on the map except for a small corner inset. In 1998, a map of the Staten Island Railway was added to that inset. That year, the map was digitized so that it could be edited via computer: in this edition, incongruous small details were removed or revised.[25] Despite the revisions made to the 1998 map, several errors persisted through the 21st century: for instance, the intersection of Broadway and West End Avenue in the Upper West Side was depicted as being several blocks away from its true location.[37] A special-edition map was released in 2004 to mark the restoration of service on the Manhattan Bridge following the conclusion of the Manhattan Bridge subway closures, which had required construction on the bridge's subway tracks for 18 years.[38]
The latest major revision to the official subway map, which took effect on June 27, 2010, makes Manhattan bigger and Staten Island smaller.[39][40][41] Several smaller streets were also removed.[42] A late night-only version of the map was introduced on January 30, 2012.[43]
現在の路線図
[編集]The current official map of the subway system, based on the Tauranac redesign, incorporates a complex cartography to explain the subway's nomenclature. Different services that share a "trunk line" were assigned the same color; the trunk lines comprised all of the main lines within lower and midtown Manhattan, as well as the IND Crosstown Line, a trunk line that does not go into Manhattan. Express services were denoted with a separate stroke that bypassed all of the local stops. Transfers between stations were denoted by a thinner black stroke.[25]
The official map is not geographically accurate due to the complexity of the system. For example, since Lower Manhattan and Downtown Brooklyn contain high densities of subway stations, these areas are shown as larger than they actually are. Likewise, Staten Island is shown in an inset because it does not have any subway stations, only the Staten Island Railway. Nevertheless, the map is known to help tourists navigate the city, as major city streets are shown alongside the subway stations serving them.[25]
The New York City Subway map is an anomaly among subway maps around the world, in that it shows city streets, parks, and neighborhoods juxtaposed among curved subway lines, whereas other subway maps (like the London Underground map) do not show such aboveground features and show subway lines as straight and at 45- or 90-degree angles.[44] However, only ten buildings are actually shown on the map: four are in Staten Island, while a fifth is the New York Transit Museum in Brooklyn. The current map, significantly changed from Tauranac's original redesign, uses over 20 font styles.[25]
ライブ地下鉄路線図
[編集]In October 2020, the MTA launched a digital version of the map showing real-time service patterns and service changes, designed by Work & Co.[45][46] The real-time map uses a variation of the Vignelli map, with each route being depicted on its own band rather than being grouped by their trunk color. For instance, the 4, 5, and 6 trains would be shown as three bands, despite sharing the IRT Lexington Avenue Line, which would be depicted as a single band on the Tauranac/Hertz map. The real-time map also uses geographical landmarks, as the Tauranac/Hertz map does. In the beta version of the map, the bands were not necessarily correlated to their real-life locations.[46]
スピンオフ
[編集]There are several privately produced schematics that are available either online or in published form—such as KickMap, a hybrid diagram subway map that shows each route on its own line segments plus New York's parks, streets and neighborhoods;[47] and Bullet Map, a map that shows bus and rail connections in more complexity.[48] Additionally, the New York City Subway map has served as the subject of artistic endeavors. Among these are works by Fadeout Design and by Alexander Chen.[49][50] In the past, companies such as Hagstrom Map had also published New York City Subway maps.[6]
There are other subway map spinoffs as well, such as New York City Subway track schematics.[51][52] In 2014 an augmented reality subway map was made available for the subway.[53] Additionally, "On The Go! Travel Stations" are electronic maps located in stations that make use of touchscreen technology to help subway patrons plan trips.[54] Google Maps and Apple Maps also give transit directions, with the locations of stations laid over an actual street grid. Such maps have been increasingly prevalent.[55]
On the real-time map, the MTA uses its existing data feeds to show the locations of trains, depicted by darker bars moving along each respective subway route. Clicking on a station would also give information on the status of escalators and elevators in a station.[46]
Unlike similar apps, the real-time map does not use the Google Maps platform.[46] Manhattan's street grid is oriented 29 degrees from true north,[56] and the real-time map uses an orientation that follows Manhattan's street grid rather than the cardinal directions. However, the mobile version of Google Maps would not allow map rotation.[46]
特別な路線図
[編集]週末の路線図
[編集]In 2011, the MTA began to look at ways of displaying service disruptions due to weekend engineering works in a visual format. They invited Vignelli Associates (comprising at that time Massimo Vignelli, Yoshiki Waterhouse, and Beatriz Cifuentes) to develop a digital version of the 2008 map. On September 16, 2011, the MTA introduced a Vignelli Associates interactive subway map, called "The Weekender",[57] to its website.[58] As the title suggests,[59] it is a way for riders to get information about any planned work, from late Friday night to early Monday morning, that is going on either on a service(s) or station(s) of the subway during the weekend only.[60][61] On June 11, 2012, the MTA duplicated "The Weekender" site as a free mobile app download for iOS.[62][63] On November 29, 2012, an Android version of the app was released.[64] The Weekender, however, is only available as an online version, because it changes every week.[43] The map design was inspired by Massimo Vignelli's 1972 subway map.[65]
夜の営業の路線図
[編集]A night-service map, created by Charles Gordanier of the MTA, was first released in January 2012.[43][66][67] The maps come in printed versions or as an online PDF file. Formerly, the maps were only available online or at certain stations, but 2014年10月現在[update], the maps started to be issued at all stations in the New York City Subway and Staten Island Railway systems.[68]
地域交通の路線図
[編集]A special transit map was designed by Yoshiki Waterhouse at Vignelli Associates for Super Bowl XLVIII, the "Mass Transit Super Bowl". The game was played on February 2, 2014, at MetLife Stadium at the Meadowlands Sports Complex in East Rutherford, New Jersey. It was the first Super Bowl played outdoors in a cold-weather city.
Called the "Regional Transit Diagram", the map was initially produced specifically for Super Bowl XLVIII, and according to the MTA, "shows all inter-connections between the regional transit services, and highlights with a football icon those areas where Super Bowl related events will occur on both sides of the Hudson River. The diagram will appear on all transit provider websites, as well as on Super Bowl websites, guides, publications, mobile apps, and folding pocket maps." Since private cars were not allowed to park at the stadium, the use of public transportation had correspondingly been increased. With 400,000 visitors expected to the area and 80,000 attendees expected at the game itself, the MTA decided to work with New Jersey Transit (NJT), Amtrak, and NY Waterway to produce a special-purpose Regional Transit Map and create the Mass Transit Super Bowl plan.[69]
The map is based on a New York City Subway map originally designed by Vignelli in 1972. The map shows all the commuter rail, subway, PATH, and light rail operations in urban northeastern New Jersey and Midtown and Lower Manhattan highlighting Super Bowl Boulevard, Prudential Center, MetLife Stadium and Jersey City.[70][71][72]
The map brought in several innovations:
- The transit map showed both New York and New Jersey, and was the first time that an MTA-produced subway map had done that.[73]
- Besides showing the New York City Subway, the map also includes the MTA's Metro-North Railroad and Long Island Rail Road, New Jersey Transit lines, and Amtrak lines in the consistent visual language of the Vignelli map.
- For the first time since 1979, the MTA issued a Vignelli map on paper.
- For the first time, a Vignelli map added in topographic features, such as the MetLife Stadium, the Prudential Center, and the Super Bowl Boulevard.
September 2018年現在[update], the diagram is still updated online and remains accessible on the MTA's website.[74]
パロディー
[編集]In September 2015, a map detailing the number of calories burnt walking between adjacent subway stops was developed by Treated.com and featured on the websites of Gothamist[75] and Time Out.[76]
A "beer map" was created to show the best bars that are close to each station.[77] The website Thrillist also created a "judgmental map" of each station in Manhattan.[78]
In May 2017, Brooklyn resident Andrew Lynch created a geographically accurate map of the system's tracks, which was featured on Gothamist.[79]
将来の路線図
[編集]In 2020, the MTA displayed several new map concepts at the 86th Street station on the BMT Fourth Avenue Line following a renovation project.[80] Six maps were displayed:
- A current version of the Vignelli map[81][82][83]
- A neighborhood map designed in conjunction with the Department of Transportation (already installed at all subway stations)[84]
- A bus map of the immediate area[85]
- A geographically accurate layout of the subway system along with Select Bus Service routes[86][83]
- A flat diagram of the station[87]
- A 3D diagram of the station[88]
The MTA solicited feedback from the public on these new maps through an online survey.[89][90][82] This test expanded in 2021 to include several other stations including 116th Street, Fulton Street, Nostrand Avenue, Times Square and in-car maps on the 42nd Street Shuttle.[91] The station diagrams were no longer part of the project, while the four other concepts (the Vignelli map, area bus map, geographically accurate subway map, and flat station diagram) remain.[91] The MTA hopes these maps would be better than the current Hertz map to show how the subway operates.[92] The MTA reported in October 2021 that it had received positive feedback,[90] prompting the agency to gradually install the four concepts systemwide in the coming months.[92]
地下鉄路線の色分け
[編集]色分けの歴史
[編集]
From 1904 to 1967, subway routes on the official subway map were drawn either in a single color or in three colors, which corresponded to the company that the route operated on — the IRT, BMT, or IND.[93] Still, after the 1940 unification of the three companies' routes under the umbrella of a Board of Transportation—later the New York City Transit Authority (NYCTA)—the three networks continued to operate separately and were generally referred to by their old names.[94] Both maps and the station signage continued to refer to the historical IRT, BMT, and IND. In 1964, a major review of wayfinding was triggered by the combination of two things: the large influx of visitors for the 1964 New York World's Fair, which made the subway and bus maps confusing to some visitors; and the connection of the BMT and IND networks through the 60th Street Tunnel Connection and the soon-to-be-opened Chrystie Street Connection, which rendered the three-color scheme unworkable.
In 1964, the NYCTA launched the Subway Map Competition to get public input on redesigning the subway map, and in 1966 it engaged Unimark International to advise on signage and on the results of the Subway Map Competition. The winners of the competition were R. Raleigh D’Adamo,[95] Harris Schechtman, and Mary & John Condon.[96] The TA forwarded D’Adamo's report[97] on his competition map to Professor Stanley Goldstein of Hofstra University, who was engaged to develop prototype maps. Goldstein reported in June 1965,[98] and two of his prototype maps were combined by the TA Designs Division, and the result passed to Diamond Packaging, who refined the design and printed the NYCTA's first route-colored subway map in November 1967. To coordinate with the new color scheme in the map, the NYCTA began to roll out new station and car signage based on a design by Vignelli and Robert Noorda of Unimark International, using the route markers derived from those specified in D’Adamo's report.
The biggest innovation in this redevelopment of the map was the introduction of color-coding by subway route, which D’Adamo recommended in his report to replace the outdated three-color scheme. After some experimentation, D’Adamo found a set of colors for subway lines that avoided clashes; Goldstein used D’Adamo's concept but invented his own color allocation; and finally Dante Calise at Diamond Packaging devised the color assignment that was used in the published map of 1967. Those colors were inherited by Unimark International and used in the famous 1972 Vignelli map.[99][100] That color scheme was rearranged by Tauranac in 1979 to create a trunk-colored map.
現在の色分け
[編集]The colors used to denote services in the current iteration of the subway map are as follows:
| 基幹路線 | 色[101][102] | パントン [103] | 16進 | 系統ラベル |
|---|---|---|---|---|
| IND8番街線 | ビビッド・ブルー | PMS 286 | #2850ad | |
| IND6番街線 | ブライト・オレンジ | PMS 165 | #ff6319 | |
| INDクロスタウン線 | ライム・グリーン | PMS 376 | #6cbe45 | |
| BMTカナーシー線 | ライト・スレート・グレー | 50% black | #a7a9ac | |
| BMTナッソー・ストリート線 | テラコッタ・ブラウン | PMS 154 | #996633 | |
| BMTブロードウェイ線 | サンフラワー・イエロー | PMS 116 | #fccc0a | |
| IRTブロードウェイ-7番街線 | トマト・レッド | PMS 185 | #ee352e | |
| IRTレキシントン・アベニュー線 | アップル・グリーン | PMS 355 | #00933c | |
| IRTフラッシング線 | ラズベリー | PMS Purple | #b933ad | |
| シャトル | ダーク・スレート・グレー | 70% black | #808183 |
サービスラベルと色の使用状況
[編集]This is a table of when each service has existed (and been signed for the public). Shuttles were SS until 1985, when they became S (which had been used for specials). See here for the colors used for shuttles in 1967; in 1968 all six became green, and in 1979 all shuttles became dark gray. The maps were adjusted according to the service letters, numbers, and colors used at the time.
Before the 1960s, service colors were disregarded, as maps usually showed all subway routes of one company in the same color, using only three colors for the lines of the three companies.

ギャラリー
[編集]地下鉄路線図の変遷
[編集]-
 BMT, 1912
 -
 BMT, 1924
 -
 BMT, 1931
 -
 BMT, 1933
 -
 BMT, 1940
 -
 IND, 1939
 -
 2013
2013


関連画像
[編集]-
 代わりの地下鉄路線図
 -
 深夜の営業路線図
 -
 1929年時点の延伸計画
 -
 1939年時点の延伸計画
 -
 路線図のグッズ


参照
[編集]- Tube map – Map for the London Underground
脚注
[編集]- ^ Gianatasio, David (October 28, 2020). “Inside Work & Co's Design of NYC's New Live Subway Map”. Muse. Template:Cite webの呼び出しエラー:引数 accessdate は必須です。
- ^ Bonanos, Christopher (October 20, 2020). “First Look: New York's Digital Subway Map Comes Alive Today”. CURBED.com. Template:Cite webの呼び出しエラー:引数 accessdate は必須です。
- ^ “IRT Route Map”. IRT Company. nycsubway.org. May 28, 2014閲覧。
- ^ a b c d e Kelsey Campbell-Dollaghan (September 3, 2013). “15 Subway Maps That Trace NYC's Transit History”. Gizmodo. May 28, 2014閲覧。
- ^ a b A History of New York City Subway Maps Archived May 29, 2014, at the Wayback Machine.
- ^ a b Paul A. Shaw (November 18, 2008). “The (Mostly) True Story of Helvetica and the New York City Subway”. AIGA. aiga.org. February 4, 2009閲覧。
- ^ Hogarty, Dave (August 3, 2007). “Michael Hertz, Designer of the NYC Subway Map”. Gothamist. August 18, 2009時点のオリジナルよりアーカイブ。July 4, 2009閲覧。
- ^ “Dreaming of the Second System: Where the subways should go :: Second Ave. Sagas”. Secondavenuesagas.com (September 19, 2008). May 28, 2014閲覧。
- ^ “1970s NYC Subway Map That Never Was — Business Insider”. Business Insider (June 18, 2013). Template:Cite webの呼び出しエラー:引数 accessdate は必須です。
- ^ “1940 BMT Division map”. nycsubway.org (1940年). March 18, 2015閲覧。
- ^ “1948 Hagstrom map issued by Board of Transportation” (1948年). March 18, 2015閲覧。
- ^ George Salomon (c. 1955), three typescript booklets, held in the Archives of the New York Transit Museum, Brooklyn: (a) "Out of the Labyrinth: A plea and a plan for improved passenger information on the New York subways". (b) "Orientation". (c) "Orientation on the New York Subway (a ‘scrapbook’)".
- ^ “1959 Salomon map” (1959年). March 18, 2015閲覧。
- ^ a b “1967 Chrystie Street Connection New Routes” (1967年). August 24, 2015閲覧。
- ^ a b “Peter B. Lloyd, "Vignelli: Transit Maps" (RIT Press, 2012)”. September 29, 2015時点のオリジナルよりアーカイブ。August 23, 2015閲覧。 p. 47
- ^ “Free Subway Maps a Best Nonseller”. The New York Times. (August 8, 1972). ISSN 0362-4331 December 25, 2016閲覧。
- ^ “New Subway Maps Introduced; To Be Distributed Next Monday”. The New York Times. (August 5, 1972). ISSN 0362-4331 December 25, 2016閲覧。
- ^ Rawsthorn, Alice (2012年8月5日). “The Subway Map That Rattled New Yorkers” (英語). The New York Times. ISSN 0362-4331 2019年12月2日閲覧。
- ^ Minutes of the Subway Map Committee, December 17, 1976.
- ^ Minutes of Subway Map Committee, June 30, 1977
- ^ New York Times, February 9, 1978, Paul Goldberger, "Putting the Subways on a New Map"
- ^ Minutes of Subway Map Committee, March 3, 1978.
- ^ The Times, May 8, 1978, Michael Leapman, column: "Leapman in America"
- ^ Tauranac, John. letter to New York Times, June 27, 1979. New York Transit Museum.
- ^ a b c d e f Luca, Antonio de; Portis, Sasha (2019年12月2日). “The New York City Subway Map as You've Never Seen It Before” (英語). The New York Times. ISSN 0362-4331 2019年12月2日閲覧。
- ^ MTA Press Releases #86 and #87, June 24, 1979
- ^ “The 1979 New York City Subway Map: A Question of Authorship, Part I” (September 12, 2010). March 17, 2015閲覧。
- ^ “The 1979 New York City Subway Map: A Question of Authorship, Part II” (September 12, 2010). March 17, 2015閲覧。
- ^ This statement is based on the existing minutes of the Subway Map Committee and interviews by Peter B. Lloyd with the traceable members of the committee, related MTA staff, and staff of Michael Hertz Associates
- ^ Haberman, Clyde (2009年12月14日). “John Tauranac's Subway Maps, Like the W and Z Lines, Will Be Obsolete” (英語). The New York Times. ISSN 0362-4331 2019年12月2日閲覧。
- ^ Tauranac, John. memo to Subway Map Committee, March 5 , 1979. New York Transit Museum.
- ^ Phyllis Cerf Wagner, interviewed by Barbaralee Diamonstein, September 1978, tapes held at Columbia University
- ^ “A New Subway Map That Goes Back to Basics” (英語). The New York Times. (1979年5月25日). ISSN 0362-4331 2019年12月2日閲覧。
- ^ Goldberger, Paul (1979年8月2日). “At Last, A Usable Subway Map” (英語). The New York Times. ISSN 0362-4331 2019年12月2日閲覧。
- ^ “The Best Subway Map in Years” (英語). The New York Times. (1979年7月1日). ISSN 0362-4331 2019年12月2日閲覧。
- ^ “TRAVEL ADVISORY; Multilingual Subway Map” (英語). The New York Times. (1991年8月18日). ISSN 0362-4331 2019年12月2日閲覧。
- ^ Flegenheimer, Matt (2012年5月6日). “On New York Subway Map, a Wayward Broadway and Phantom Blocks” (英語). The New York Times. ISSN 0362-4331 2019年12月2日閲覧。
- ^ Luo, Michael (2003年12月25日). “Revised Subway Map (and Alphabet) Awaits Riders in '04” (英語). The New York Times. ISSN 0362-4331 2019年12月2日閲覧。
- ^ Grynbaum, Michael M. (2010年5月27日). “New York Subway System Is Getting a New Map” (英語). The New York Times. ISSN 0362-4331 2019年12月2日閲覧。
- ^ New Subway Map is Here MTA.info website. Retrieved June 18, 2010.
- ^ “Subway Map” (PDF). Metropolitan Transportation Authority (September 2014). 2014年10月7日閲覧。
- ^ Grynbaum, Michael M. (2011年10月10日). “A Village Street Slips Quietly Off the Subway Map” (英語). City Room. 2019年12月2日閲覧。
- ^ a b c Christine Haughney (January 30, 2012). “Looking for That Midnight Train to Jamaica?”. New York Times. March 19, 2015閲覧。
- ^ Mindlin, Alex (2006年9月3日). “Win, Lose, Draw: The Great Subway Map Wars” (英語). The New York Times. ISSN 0362-4331 2019年12月2日閲覧。
- ^ “MTA launches first real-time digital subway map”. 6sqft (October 20, 2020). October 20, 2020閲覧。
- ^ a b c d e Bonanos, Christopher (October 20, 2020). “First Look: New York's Digital Subway Map Comes Alive Today”. Curbed. October 20, 2020閲覧。
- ^ “ABOUT THE KICK MAP”. www.kickmap.com. September 21, 2016閲覧。
- ^ Denaro, Anthony (August 8, 2016). “Mapping NYC Transit. All of it.”. Medium. A Medium Corporation. September 21, 2016閲覧。
- ^ TRANSPORTNATION | New York City. Retrieved August 26, 2011.
- ^ Artist Turns New York Subway Map Into a Musical Instrument. Retrieved August 26, 2011.
- ^ New York City Trackbook
- ^ NYC Subway Track Maps
- ^ Bell, Karissa (May 24, 2014). “Tunnel Vision Uses Augmented Reality to Animate NYC Subway Maps” (英語). Mashable. 2020年10月20日閲覧。
- ^ “MTA's First "On The Go" Touchscreen Unveiled In Bowling Green”. NY1. (September 19, 2011). オリジナルのSeptember 12, 2012時点におけるアーカイブ。 October 5, 2011閲覧。
- ^ andyjayhawk (October 29, 2015). “The Great Subway Map War of 1978, revisited”. The Verge. November 12, 2015閲覧。
- ^ Koeppel, Gerard (2015). City on a grid : how New York became New York. Boston, MA: Da Capo Press, a member of the Perseus Books Group. p. 101. ISBN 978-0-306-82284-1. OCLC 902657028
- ^ “Introducing The Weekender”. MTA.info (YouTube) (September 30, 2011). October 1, 2011閲覧。
- ^ “The Weekender”. MTA.info. October 12, 2013閲覧。
- ^ Grynbaum, Michael M. (September 15, 2011). “Aid for Baffled Weekend Subway Riders”. The New York Times September 30, 2011閲覧。
- ^ “Introducing 'The Weekender'”. MTA.info. (September 16, 2011) September 18, 2011閲覧。
- ^ “MTA Launches Interactive Online Map Ahead Of Difficult Weekend For Subways”. NY1. (September 16, 2011) September 18, 2011閲覧。[リンク切れ]
- ^ “MTA Releases "Weekender" Smartphone App”. NY1. (June 11, 2012). オリジナルのJune 16, 2012時点におけるアーカイブ。 June 13, 2012閲覧。
- ^ “'The Weekender' Is Now an iPhone App”. MTA.info. (June 11, 2012) June 13, 2012閲覧。
- ^ “MTA's 'Weekender' App Comes to Android Devices”. MTA.info. (November 29, 2012) October 20, 2013閲覧。
- ^ “Mta.info | 110 Years of the Subway”. Template:Cite webの呼び出しエラー:引数 accessdate は必須です。
- ^ “Limited Quantities Available of our First Late Night Map”. MTA.info (January 30, 2012). March 17, 2015閲覧。
- ^ “Subway Night Map”. MTA.info (January 30, 2012). March 17, 2015閲覧。
- ^ “The City That Never Sleeps Gets Map Update for Late Night Subway Service”. MTA.info (October 6, 2014). March 19, 2015閲覧。[リンク切れ]
- ^ “MTA Press Release, "MTA Creates First Regional Transit Diagram for Super Bowl XLVIII"” (December 10, 2013). March 18, 2015閲覧。
- ^ Chung, Jen (December 10, 2013). “Map: 2014 NY/NJ Super Bowl's Gorgeous Vignelli Mass Transit Map”. Gothamist. オリジナルのDecember 14, 2013時点におけるアーカイブ。 December 20, 2013閲覧。
- ^ "MTA Creates First Regional Transit Diagram for Super Bowl XLVIII" (Press release). Metropolitan Transportation Authority. 10 December 2013. 2013年12月22日閲覧。“Regional Transit Diagram 2014”. New Jersey Transit. December 22, 2013閲覧。
- ^ Napoliello, Alex (December 11, 2013). “MTA designs regional Super Bowl mass transit map”. The Star-Ledger December 22, 2013閲覧。
- ^ “Thanks to the Super Bowl, New York Has Its Very First Regional Transit Map” (January 31, 2014). March 18, 2015閲覧。
- ^ “MTA Neighborhood Maps: Regional Diagram”. mta.info. Metropolitan Transportation Authority (2018年). October 1, 2018閲覧。
- ^ Carlson, Jen. “Map Shows How Many Calories You Can Burn By Not Taking The Subway”. Gothamist. January 15, 2016時点のオリジナルよりアーカイブ。January 11, 2016閲覧。
- ^ “Map shows how many calories you'd burn by walking over taking the subway”. Time Out New York. January 11, 2016閲覧。
- ^ Kasick, Paige (July 18, 2014). “Fun Maps: Find The Best NYC Bars Near Each Subway Station”. Untapped Cities. January 11, 2016閲覧。
- ^ “Crude Subway Map Tells the Truth About Each Manhattan Stop”. Curbed NY (March 12, 2015). January 11, 2016閲覧。
- ^ Chung, Jen (2017年5月11日). “Brooklyn Man Creates 'Complete & Geographically Accurate' NYC Subway Map” (英語). Gothamist. オリジナルのOctober 16, 2017時点におけるアーカイブ。 2017年5月13日閲覧。
- ^ Yakas, Ben (2020年7月31日). “Photos: MTA Is Trying Out Six Reimagined Subway Maps At Brooklyn Station” (英語). Gothamist. 2021年12月27日閲覧。
- ^ “New subway poster” (英語). Gothamist. 2021年12月27日閲覧。
- ^ a b Weaver, Shaye (October 15, 2021). “The MTA just released a new subway map for NYC”. Time Out New York. December 27, 2021閲覧。
- ^ a b Kimball, Whitney (October 14, 2021). “New Subway Map Just Dropped”. Gizmodo. December 27, 2021閲覧。
- ^ “New subway poster” (英語). Gothamist. 2021年12月27日閲覧。
- ^ “New subway poster” (英語). Gothamist. 2021年12月27日閲覧。
- ^ “New subway poster” (英語). Gothamist. 2021年12月27日閲覧。
- ^ “New subway poster” (英語). Gothamist. 2021年12月27日閲覧。
- ^ “New subway poster” (英語). Gothamist. 2021年12月27日閲覧。
- ^ “Exploring new ways to help you get around with reimagined maps” (英語). MTA. 2021年12月27日閲覧。
- ^ a b Deighton, Katie (2021年10月13日). “MTA Tests New Subway Map That Evokes Jettisoned 1972 Version” (英語). Wall Street Journal. ISSN 0099-9660 2021年12月27日閲覧。
- ^ a b “Exploring new ways to help you get around with reimagined maps” (英語). MTA. 2021年12月27日閲覧。
- ^ a b Berg, Nate (2021年10月14日). “See NYC's bold new subway map, inspired by Massimo Vignelli's 1972 classic” (英語). Fast Company. 2021年12月27日閲覧。
- ^ "Rapid Transit Map of Greater New York", a 1939 map of the subway, created before the companies were unified in 1940
- ^ "Rapid Transit Lines of the New York City Transit System", a 1948 map of the subway
- ^ Polytechnic University Cable 34:2 Winter 2007 p.7
- ^ "3 Win Transit Authority Prizes For Designs of Subway Maps", New York Times, October 17, 1964
- ^ Memorandum of Explanation by R. Raleigh D’Adamo, accompanying entry to the NYCTA Subway Map Competition, September 24, 1964. 19 pp. Plus Corrigenda, September 30, 1964, 2 pp.
- ^ Methods of Improved Subway Information, report submitted to NYCTA by Stanley P. Goldstein, Professor of Engineering at Hofstra University, June 10, 1965. 40 pp.
- ^ “Peter B. Lloyd, "Vignelli: Transit Maps" (RIT Press, 2012)”. September 29, 2015時点のオリジナルよりアーカイブ。August 23, 2015閲覧。
- ^ New York City Subway map, 1972, based on Vignelli's design
- ^ Official paint monikers since the colors were fixed in 1979: Grynbaum, Michael (May 10, 2010). “Take the Tomato 2 Stops to the Sunflower”. New York Times, City Room Blog. May 11, 2010閲覧。
- ^ Official MTA video mentions "lime green" for the G line. “Subway Colors and Names”. MTA Info (July 15, 2010). August 5, 2010閲覧。
- ^ “mta.info - Developer Data Downloads”. mta.info. August 5, 2010閲覧。
参考文献
[編集]- The Best Subway Map in Years, New York Times July 1, 1979 page E20
外部リンク
[編集]公式の路線図 :
- URLが見つかりません。ここでURLを指定するかウィキデータに追加してください。
- “Subway Map” (PDF). Metropolitan Transportation Authority (September 2014). 2014年10月7日閲覧。
- Subway Map (Zoomable)
- The Weekender
- Late Night Subway Service map
非公式の路線図 :
- Catalog of NYC subway maps since 1944
- 1972 NYC subway map by Vignelli
- NYC Subway operations (unofficial map)
- TransitMe: full screen New York City Subway maps